The following graph represents a competitive market for a product.where the government now has introduced a price floor of 0C.Which area in the graph represents the producers' revenue after the imposition of the price floor? 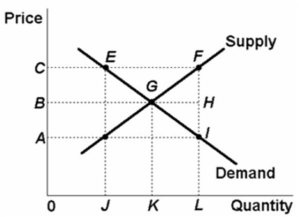
A) 0CFL
B) 0CEJ
C) 0BGK
D) 0BHL
Correct Answer:
Verified
Q156: An effective price floor on wheat will
A)
Q268: A government set minimum wage:
A)imposes a legal
Q269: Price ceilings and price floors:
A)cause surpluses and
Q270: The demand for commodity X is represented
Q271: Which would be an example of a
Q273: Which is most likely to be observed
Q274: In recent years, there has been a
Q275: Shortages and surpluses can occur in markets
Unlock this Answer For Free Now!
View this answer and more for free by performing one of the following actions

Scan the QR code to install the App and get 2 free unlocks

Unlock quizzes for free by uploading documents