Multiple Choice
 Refer to the above diagram.Curve B is a:
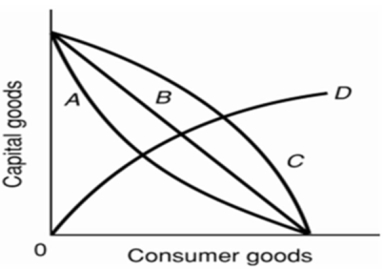
A) production possibilities curve indicating constant opportunity costs.
B) production possibilities curve indicating increasing opportunity costs.
C) demand curve indicating that the quantity of consumer goods demanded increases as the price of capital falls.
D) technology frontier curve.
Correct Answer:
Verified
Related Questions
Q103: The fact that the slope of the
Q150: A nation's production possibilities curve is "bowed
Q151: If the production possibilities curve is a
Q152: The law of increasing opportunity costs is
Q153: Refer to the diagram below.The concept of
Q154: The production possibilities curve below shows the

