Complete the accompanying table.  Using the below graphs, show the consumption and saving schedules graphically.
 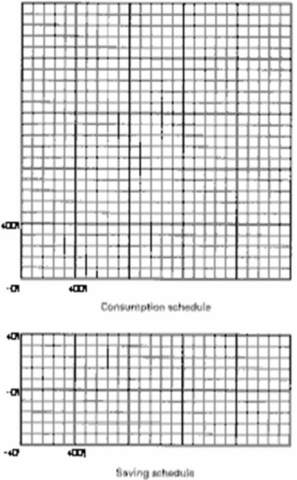 (b) Locate the break-even level of income.How is it possible for households to dissave at very low income levels?
(c) If the proportion of total income consumed decreases and the proportion saved increases as income rises, explain both verbally and graphically how the MPC and MPS can be constant at various levels of income.
Correct Answer:
Verified
View Answer
Unlock this answer now
Get Access to more Verified Answers free of charge
Q5: Complete the accompanying table. Q6: Use the following data to answer the Q7: Explain how consumption and saving are related Q8: State four factors that explain why investment Q9: Explain the difference between a movement along Q11: List four factors that could shift the Q12: What is the effect of increase in Q13: Complete the following table assuming that (a) Q14: Use the graphs below to answer the Q15: Complete the following table assuming that (a)![]()
Unlock this Answer For Free Now!
View this answer and more for free by performing one of the following actions

Scan the QR code to install the App and get 2 free unlocks

Unlock quizzes for free by uploading documents