The next three questions refer to the below supply and demand graph for a public good. 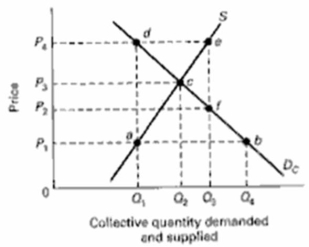 (a) What does point c represent?
(b) What does the line segment ef at output Q3 represent?
(c) At what output level is there an underallocation of resources to the production of this public good?
Correct Answer:
Verified
View Answer
Unlock this answer now
Get Access to more Verified Answers free of charge
Q2: Demand is represented by the equation, P
Q3: What is producer surplus?
Q4: Demand is represented by the equation, P
Q5: In your own words, describe what free-riding
Q6: How is consumer surplus derived from a
Q8: Demand in a market is represented by
Q9: Demand in a market is represented by
Q10: How is producer surplus derived from a
Q11: Draw a market supply curve and indicate
Q12: What is the meaning of Market Failures
Unlock this Answer For Free Now!
View this answer and more for free by performing one of the following actions

Scan the QR code to install the App and get 2 free unlocks

Unlock quizzes for free by uploading documents