 Figure 9.4
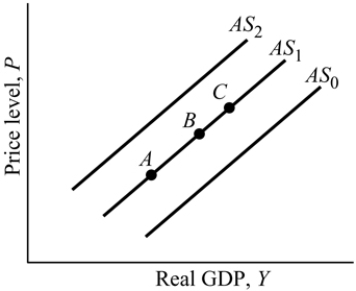
-Refer to Figure 9.4. The flooding in the Midwest during the summer of 1993 destroyed a large portion of the agricultural crop in the United States. This caused:
A) the economy to move from Point B to Point A along AS1.
B) the aggregate supply curve to shift from AS1 to AS2.
C) the economy to move from Point C to Point B along AS1.
D) the aggregate supply curve to shift from AS1 to AS0.
Correct Answer:
Verified
Q62: The aggregate supply curve depicts the relationship
Q63: Q64: In the short run, the aggregate supply Q65: Recall Application 2, "Two Approaches to Determining Q66: If the consumption function is C = Q68: If the marginal propensity to consume is Q69: The aggregate demand curve would shift to Q70: The _ is one reason why the Q71: Sticky prices cause an economic coordination problem Q72: If prices are slow to adjust, then![]()
Unlock this Answer For Free Now!
View this answer and more for free by performing one of the following actions

Scan the QR code to install the App and get 2 free unlocks

Unlock quizzes for free by uploading documents