 Figure 4.6
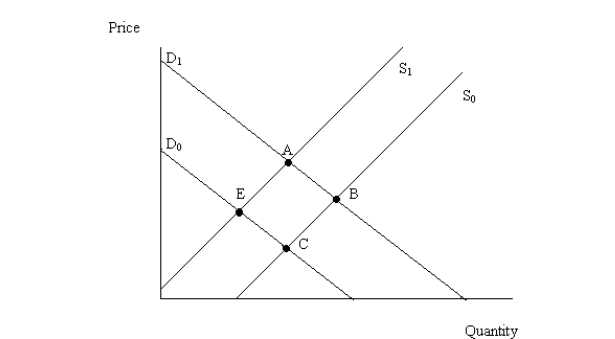
-Figure 4.6 illustrates a set of supply and demand curves for a product. When the economy moves from point A to point B, there has been:
A) an increase in supply and an increase in quantity demanded.
B) an increase in quantity supplied and an increase in demand.
C) an increase in supply and an increase in demand.
D) an increase in quantity supplied and an increase in quantity demanded.
Correct Answer:
Verified
Q9: The quantity of a product that consumers
Q11: A change in the quantity demanded of
Q12: Recall Application 1, "Hurricane Katrina and the
Q15: Recall Application 5, "Droughts in Australia and
Q16: Suppose you have 2 goods, X and
Q17: Suppose that the government requires that farms
Q18: A supply curve is defined as the
Q19: When there is a change in the
Q81: If the government imposes a price ceiling
Q247: Suppose that people expect that the price
Unlock this Answer For Free Now!
View this answer and more for free by performing one of the following actions

Scan the QR code to install the App and get 2 free unlocks

Unlock quizzes for free by uploading documents