 Figure 4.4
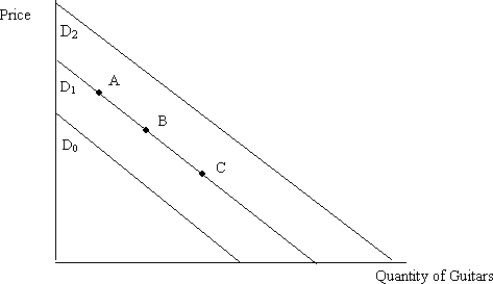
-Figure 4.4 illustrates the demand for guitars. An increase in the demand for guitars is represented by the movement from:
A) D1 to D0.
B) point B to point C.
C) D1 to D2.
D) point B to point A.
Correct Answer:
Verified
Q2: Suppose that the quantity demanded for cars
Q4: Which of the following is the least
Q5: Assume that tortilla chips and salsa are
Q8: Two goods are substitutes if:
A) the demand
Q9: The quantity of a product that consumers
Q11: A change in the quantity demanded of
Q12: Recall Application 1, "Hurricane Katrina and the
Unlock this Answer For Free Now!
View this answer and more for free by performing one of the following actions

Scan the QR code to install the App and get 2 free unlocks

Unlock quizzes for free by uploading documents