 Figure 4.6
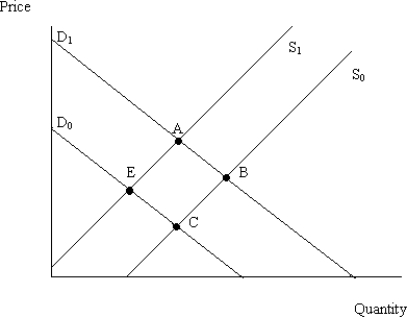
-Figure 4.6 illustrates a set of supply and demand curves for a product. When the economy moves from point E to point A, there has been:
A) an increase in quantity supplied and an increase in quantity demanded.
B) an increase in quantity supplied and an increase in demand.
C) an increase in supply and an increase in quantity demanded.
D) an increase in supply and an increase in demand.
Correct Answer:
Verified
Q72: Q84: If the government imposes a price floor Q103: Q109: Q110: A normal good is defined as a Q112: Recall Application 2, "Honeybees and the Price Q201: Peaches and cream are complements.When the price Unlock this Answer For Free Now! View this answer and more for free by performing one of the following actions Scan the QR code to install the App and get 2 free unlocks Unlock quizzes for free by uploading documents![]()
![]()
![]()

