 Figure 4.4
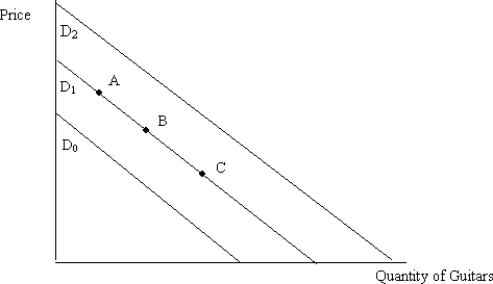
-Figure 4.4 illustrates the demand for guitars. A decrease in the demand for guitars is represented by the movement from:
A) D1 to D0.
B) D1 to D2.
C) point B to point A.
D) point B to point C.
Correct Answer:
Verified
Q118: Explain how an excess demand would lead
Q206: If the price of hotdogs are expected
Q207: Typically, a demand curve will represent what
Q209: In economics, a change in variables other
Q210: An inferior good is defined as a
Q212: Which of the following are most likely
Q213: Assume that butter and margarine are substitutes.
Q214: Recall Application 5, "Droughts in Australia and
Q215: Suppose that consumers expect that the price
Q216: ![]()
Unlock this Answer For Free Now!
View this answer and more for free by performing one of the following actions

Scan the QR code to install the App and get 2 free unlocks

Unlock quizzes for free by uploading documents