Multiple Choice
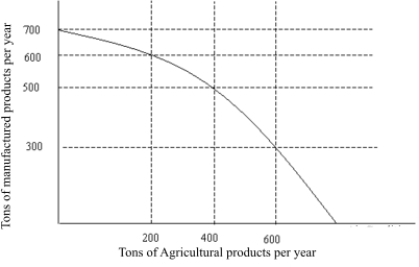 Figure 2.1
-The production possibilities curve in Figure 2.1 illustrates the notion of:
A) increased farm produce production.
B) opportunity cost.
C) increased factory goods production.
D) diminishing resources.
Correct Answer:
Verified
Related Questions
Q49: Q117: Q118: Q119: The principle that states that the cost Q121: The principle of diminishing returns does not Unlock this Answer For Free Now! View this answer and more for free by performing one of the following actions Scan the QR code to install the App and get 2 free unlocks Unlock quizzes for free by uploading documents![]()
![]()
![]()

