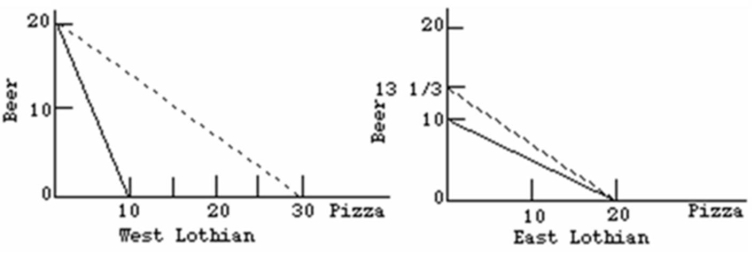
 Refer to the above diagrams.The solid lines are production possibilities curves; the dashed lines are trading possibilities curves.The data contained in the production possibilities curves are based on the assumption of:
A) imperfect substitutability of resources as between beer and pizza production.
B) constant costs.
C) decreasing costs.
D) increasing costs.
Correct Answer:
Verified
Q21: The best example of a capital-intensive good
Q24: The following is the Production possibilities tables
Q24: In a two-nation world, comparative advantage means
Q26: When Sally can paint a house and
Q30: In terms of absolute volume, world trade
Q35: The best example of a land-intensive commodity
Q36: Several new players have significantly expanded their
Q37: The bulk of Canadian export and import
Q39: Which of the following is an example
Q68: Which of the following is an example
Unlock this Answer For Free Now!
View this answer and more for free by performing one of the following actions

Scan the QR code to install the App and get 2 free unlocks

Unlock quizzes for free by uploading documents