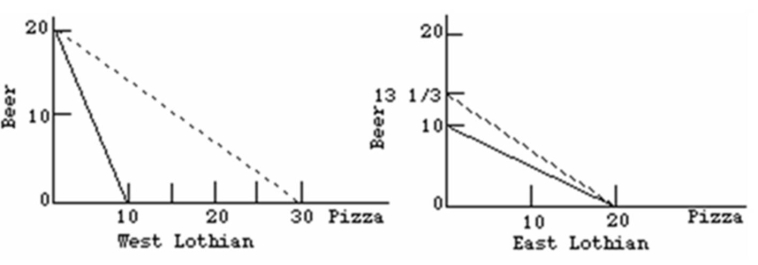
 Refer to the above diagrams.The solid lines are production possibilities curves; the dashed lines are trading possibilities curves.The opportunity cost of producing a:
A) pizza is 2 beers in both countries.
B) beer is 1/2 a pizza in both countries.
C) pizza in East Lothian is 1 beer.
D) beer in West Lothian is 1/2 a pizza.
Correct Answer:
Verified
Q18: Which of the following is an example
Q24: In a two-nation world, comparative advantage means
Q27: Differences in production efficiencies among nations in
Q28: Which products were the leading imports of
Q29: Since World War II, several factors have
Q33: Canadian exports of goods and services are
Q34: Consider two countries which trade with each
Q35: The best example of a land-intensive commodity
Q39: Given the following production possibilities schedules, it
Q40: Which products were the leading exports of
Unlock this Answer For Free Now!
View this answer and more for free by performing one of the following actions

Scan the QR code to install the App and get 2 free unlocks

Unlock quizzes for free by uploading documents