Refer to the diagrams below.The solid lines are production possibilities curves; the dashed lines are trading possibilities curves.The trading possibilities curves suggest that the terms of trade are: 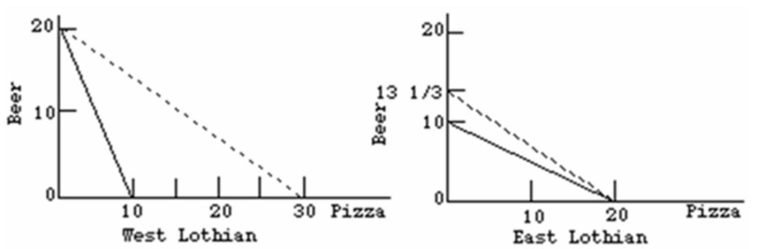
A) 1.5 beers for 1 pizza.
B) 1 beer for 2 pizzas.
C) 2 beers for 1 pizza.
D) 1 beer for 1.5 pizzas.
Correct Answer:
Verified
Q48: In the real world, specialization is rarely
Q62: Refer to the diagram below in which,
Q63: The following information is about the cost
Q64: Refer to the diagram below in which
Q67: Refer to the data below.Assume that before
Q67: The terms of trade reflects the:
A)rate at
Q69: Production possibilities data for two countries, Alpha
Q70: Which statement is true?
A)Comparative advantage means that
Q72: Refer to the diagrams below.Which of the
Q76: The law of increasing opportunity costs:
A)applies to
Unlock this Answer For Free Now!
View this answer and more for free by performing one of the following actions

Scan the QR code to install the App and get 2 free unlocks

Unlock quizzes for free by uploading documents