Refer to the graph below.The effects of stagflation, in the short run, are best represented by a shift from: 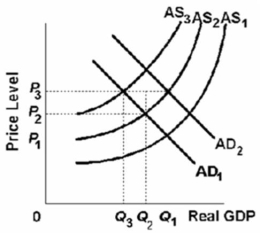
A) AD1 to AD2 given a stable AS1curve, an increase in the price level from P1to P2, and a fall in output from Q1 to Q2.
B) AD2 to AD1 given a stable AS1 curve, an increase in the price level from P1 to P2, and a fall in output from Q1 to Q2.
C) AS1 to AS2 given a stable AD1 curve, an increase in the price level from P1 to P2, and a fall in output from Q1 to Q2.
D) AS2 to AS1 given a stable AD1 curve, an increase in the price level from P1 to P2, and a fall in output from Q1 to Q2.
Correct Answer:
Verified
Q35: Inflation accompanied by falling real output and
Q88: Q88: Which of the following most significantly contributed Q90: Which factor contributed to the termination of Q90: Refer to the diagram given below.Suppose an Q92: Q92: In the conventional view, outward shifts of Q94: Refer to the graph given below. Q95: Q98: Unlock this Answer For Free Now! View this answer and more for free by performing one of the following actions Scan the QR code to install the App and get 2 free unlocks Unlock quizzes for free by uploading documents![]()
![]()
![]()
![]()

