Multiple Choice
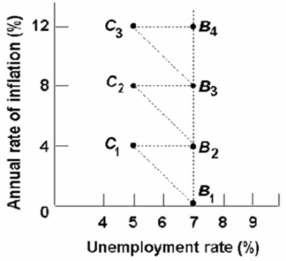 Refer to the above diagram and assume the economy is initially at point b1.According to the adaptive expectations theorists, the long-run relationship between the unemployment rate and the rate of inflation is represented by:
A) the line connecting B1 and C1.
B) the line through B1, B2, B3, and B4.
C) the line connecting C1 and B2.
D) any line parallel to the horizontal axis.
Correct Answer:
Verified
Related Questions
Q22: Statistical data for the 1970s and 1980s
Q35: Inflation accompanied by falling real output and
Q88: Which of the following most significantly contributed

