Multiple Choice
Refer to the graph given below. 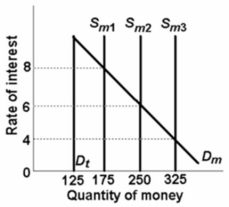 In the above graph, Dt represents the transactions demand for money, Dm represents the total demand for money, and Sm represents the supply of money.The transactions demand for money in this market is:
A) $125.
B) $175.
C) $250.
D) $325.
Correct Answer:
Verified
Related Questions
Q2: The total demand for money curve will
Q26: To have an independent monetary policy and
Q36: A decrease in the rate of interest
Q42: It is assumed that households and businesses
Unlock this Answer For Free Now!
View this answer and more for free by performing one of the following actions

Scan the QR code to install the App and get 2 free unlocks

Unlock quizzes for free by uploading documents