Refer to the graphs below.The first graph shows the money market of an economy, and the second graph shows the market for goods and services in the economy. 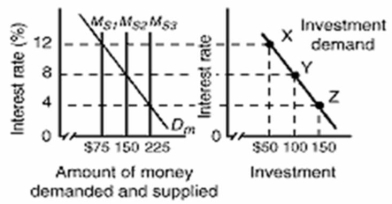
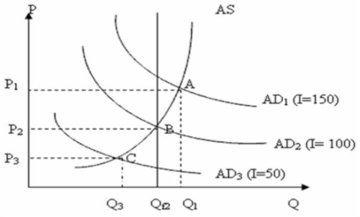 In the above diagrams, the numbers in the parentheses after the AD1, AD2, and AD3 labels indicate the levels of investment spending associated with each AD curve.All figures are in billions.Qf is the full-employment level of real output.Suppose the economy is in equilibrium at point C on the aggregate demand curve.Which of the following should the monetary authorities pursue to achieve a non-inflationary full-employment level of real GDP?
A) They should increase the money supply from $75 billion to $150 billion.
B) They should increase the money supply from $150 billion to $225 billion.
C) They should decrease the money supply from $225 billion to $50 billion.
D) They should decrease interest rates from 12 percent to 4 percent.
Correct Answer:
Verified
Q142: The interest rate at which the Bank
Q144: A headline reads: " Bank of Canada
Q154: When the Bank of Canada wants to
Q155: The overnight lending rate is the rate
Q164: The price of government bonds and the
Q172: The purpose of an expansionary monetary policy
Q174: A monetary policy-caused reduction in the overnight
Q176: An expansionary monetary policy will likely:
A)increase the
Q177: A headline reads: "Bank of Canada raises
Q179: Which of the following would provide the
Unlock this Answer For Free Now!
View this answer and more for free by performing one of the following actions

Scan the QR code to install the App and get 2 free unlocks

Unlock quizzes for free by uploading documents