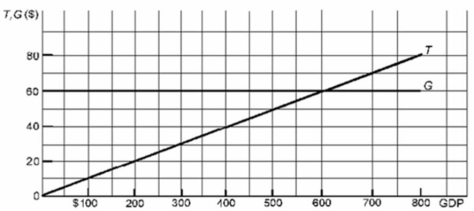
 Refer to the above diagram where T is tax revenues and G is government expenditures.All figures are in billions of dollars.If the full-employment GDP is $400 billion while the actual GDP is $200 billion, the full-employment or cyclically adjusted deficit is:
A) $40 billion.
B) zero.
C) $60 billion.
D) $20 billion.
Correct Answer:
Verified
Q125: In Year 1, the actual budget deficit
Q133: If the economy has a cyclically adjusted
Q134: Q135: Refer to the diagram below.If the full Q137: Refer to the diagram below.Which tax system Q140: If the cyclically adjusted budget shows a![]()
Unlock this Answer For Free Now!
View this answer and more for free by performing one of the following actions

Scan the QR code to install the App and get 2 free unlocks

Unlock quizzes for free by uploading documents