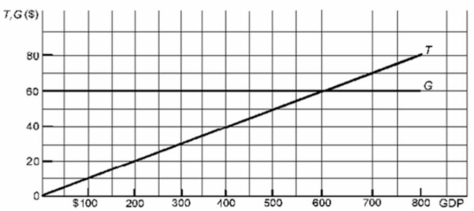
 Refer to the above diagram where T is tax revenues and G is government expenditures.All figures are in billions of dollars.If the full-employment GDP is $400 billion while the actual GDP is $200 billion, the:
A) actual budget deficit exceeds the full-employment deficit.
B) actual budget deficit is less than the full-employment deficit.
C) full-employment deficit exceeds the cyclical deficit.
D) cyclical deficit exceeds the full-employment deficit.
Correct Answer:
Verified
Q40: The cyclically adjusted budget tells us
A)that in
Q123: If the cyclically adjusted budget deficit increases
Q124: The cyclically adjusted deficit is the difference
Q125: In Year 1, the actual budget deficit
Q131: An effective expansionary fiscal policy will:
A)not change
Unlock this Answer For Free Now!
View this answer and more for free by performing one of the following actions

Scan the QR code to install the App and get 2 free unlocks

Unlock quizzes for free by uploading documents