Refer to the diagram given below. 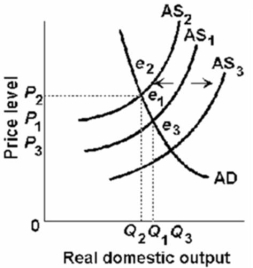 When the real output decreases from Q1 and the price level increases from P1, there should have been a:
A) shift in the aggregate supply curve from AS1 to AS3.
B) shift in the aggregate supply curve from AS2 to AS1.
C) movement along the aggregate demand curve from e2 to e1.
D) movement along the aggregate demand curve from e1 to e2.
Correct Answer:
Verified
Q111: An increase in aggregate expenditures resulting from
Q145: The aggregate expenditures model and the aggregate
Q161: A movement upward along an existing aggregate
Q162: In deriving the aggregate demand curve from
Q163: The economy experiences a decrease in the
Q167: A movement downward along an existing aggregate
Q176: An increase in net exports can be
Q177: The Canadian economy was able to achieve
Q180: In the late 1990s and early 2000s:
A)both
Q180: Refer to the diagram given below.
Unlock this Answer For Free Now!
View this answer and more for free by performing one of the following actions

Scan the QR code to install the App and get 2 free unlocks

Unlock quizzes for free by uploading documents