Multiple Choice
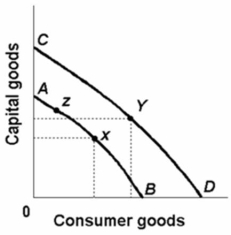 Refer to the above diagram.The most likely cause of a shift from AB to CD would be a(n) :
A) increase in productivity.
B) increase in the price level.
C) decrease in the size of the labour force.
D) recession.
Correct Answer:
Verified
Related Questions
Q63: Real GDP or total output in any
Q70: Which of the following would not be
Q73: Suppose total output (real GDP) is $4000
Q75: Which of the following is correct?
A)total output
Unlock this Answer For Free Now!
View this answer and more for free by performing one of the following actions

Scan the QR code to install the App and get 2 free unlocks

Unlock quizzes for free by uploading documents