The graphs below refer to two separate product markets.Assume that society's optimal level of output in each market is Q0 and that government purposely shifts the market supply curve from S to S1 in diagram (a) and from S to S2 in diagram (b) .The shift of the supply curve from S to S1 in diagram (a) might be caused by a per unit: 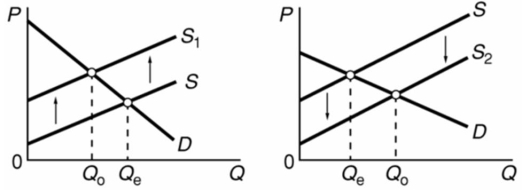
A) subsidy paid to the producers of this product.
B) tax on the producers of this product.
C) subsidy paid to the buyers of this product.
D) tax on the buyers of this product.
Correct Answer:
Verified
Q101: The socially optimal amount of pollution moderation
Q105: From society's perspective, if MB2 and MC1
Q106: There is little incentive for an individual
Q107: Refer to the below supply and demand
Q109: It has been proposed that a government
Q111: The external costs of severe air pollution
Q111: Refer to the below competitive market diagram
Q112: Which one of the following might shift
Q116: The creation of markets for pollution rights
Q144: If the production of a product or
Unlock this Answer For Free Now!
View this answer and more for free by performing one of the following actions

Scan the QR code to install the App and get 2 free unlocks

Unlock quizzes for free by uploading documents