The graphs below refer to two separate product markets.Assume that society's optimal level of output in each market is Q0 and that government purposely shifts the market supply curve from S to S1 in diagram (a) and from S to S2 in diagram (b) .The shift of the supply curve from S to S2 in diagram (b) might be caused by a per unit: 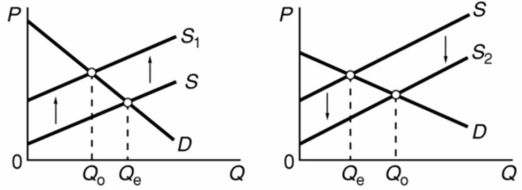
A) subsidy paid to the producers of this product.
B) tax on the producers of this product.
C) subsidy paid to the buyers of this product.
D) tax on the buyers of this product.
Correct Answer:
Verified
Q104: The optimal reduction of an externality occurs
Q106: There is little incentive for an individual
Q108: The marginal benefit to society of reducing
Q110: The creation of a market for pollution
Q111: Refer to the below competitive market diagram
Q112: Which one of the following might shift
Q115: From society's perspective, if MB1 and MC2
Q115: Refer to the information below.Which of the
Q126: The difference between the price consumers are
Q159: A market for pollution rights can be
Unlock this Answer For Free Now!
View this answer and more for free by performing one of the following actions

Scan the QR code to install the App and get 2 free unlocks

Unlock quizzes for free by uploading documents