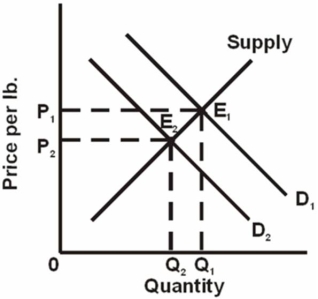
 Refer to the above graph, which shows the market for chicken where D1 and D2 represent different demand curves.A change from E1 to E2 is most likely to result from:
A) a decrease in consumer incomes.
B) an increase in the wages of chicken workers.
C) an increase in the price of beef products.
D) improved technology in the chicken industry.
Correct Answer:
Verified
Q41: If products C and D are close
Q65: An increase in the quantity demanded means
Q88: If two goods are close substitutes:
A)consumers will
Q95: Refer to the diagram, which shows demand
Q98: Lamps and light bulbs are:
A)substitute goods.
B)complementary goods.
C)independent
Q100: The demand curve for a product might
Q105: Graphically, the market supply curve is:
A)steeper than
Q108: A schedule that shows the various amounts
Q111: A decrease in supply:
A)refers to a leftward
Q113: An increase in product price will cause:
A)quantity
Unlock this Answer For Free Now!
View this answer and more for free by performing one of the following actions

Scan the QR code to install the App and get 2 free unlocks

Unlock quizzes for free by uploading documents