Refer to the diagram illustrating the market for corn.If the price in this market were to be fixed at $4 per bushel, the part of the line marked A would represent a: 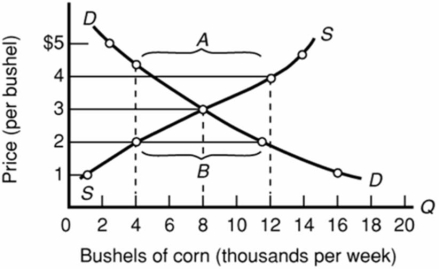
A) surplus of 8,000 bushels.
B) shortage of 8,000 bushels.
C) surplus of 7,000 bushels.
D) shortage of 7,000 bushels.
Correct Answer:
Verified
Q105: If price is above the equilibrium level,
Q115: There will be a surplus of a
Q162: The market system corrects a shortage by:
A)lowering
Q163: The rationing function of prices refers to
Q164: Q165: Q169: According to the rationing function of prices, Q173: Refer to the table. Q177: In competitive markets a surplus or shortage Q244: If the market price is above the Unlock this Answer For Free Now! View this answer and more for free by performing one of the following actions Scan the QR code to install the App and get 2 free unlocks Unlock quizzes for free by uploading documents![]()
![]()
![]()

