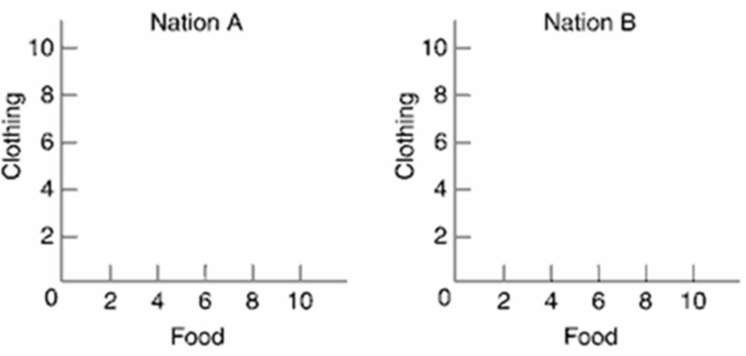
The table below shows the maximum amounts of food and clothing that two nations, A and B, can produce.Draw the production possibilities curve for A and B using the below graphs.Assume constant costs. 
 (a) What is the cost ratio for the two products?(b) If each nation specializes according to comparative advantage, who should produce and trade each product? Why?(c) What will be the range for the terms of trade? If the terms are set at 1 food = 2 clothing, show how the trading possibilities lines will change in the graph.Explain.
Correct Answer:
Verified
View Answer
Unlock this answer now
Get Access to more Verified Answers free of charge
Q3: Answer the following questions regarding international trade:(a)
Q5: In 2016, what were the top five
Q10: How important is international trade for Canada?
Q13: "The international flow of goods helps compensate
Q14: What are the economic benefits of free
Q15: The following table shows the domestic quantity
Q16: Why has international trade grown rapidly since
Q19: Suppose that by devoting all of its
Q323: How can supply and demand analysis be
Q336: Cite three important reasons why nations trade.
Unlock this Answer For Free Now!
View this answer and more for free by performing one of the following actions

Scan the QR code to install the App and get 2 free unlocks

Unlock quizzes for free by uploading documents