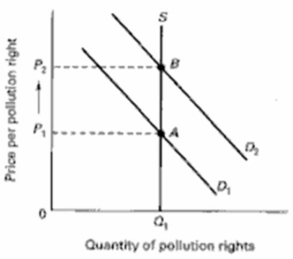
Draw a supply and demand graph on the below diagram that illustrates the market for pollution rights.Label the axes and curves.Then show what happens to price and quantity when the demand for pollution rights increases in the market. 
Correct Answer:
Verified
View Answer
Unlock this answer now
Get Access to more Verified Answers free of charge
Q22: Describe how a market for externality rights
Q23: Evaluate: "Pollution is undesirable.Therefore, all pollution should
Q25: What is the economic rationale for liability
Q26: Evaluate.Economy in government requires that government minimize
Q27: Assume the atmosphere of an urban area
Q28: The following table shows marginal costs and
Q28: What resource problem is created by positive
Q31: What are quasi-public goods and why does
Q32: What resource problem is created by negative
Q34: Assume the atmosphere of an urban area
Unlock this Answer For Free Now!
View this answer and more for free by performing one of the following actions

Scan the QR code to install the App and get 2 free unlocks

Unlock quizzes for free by uploading documents