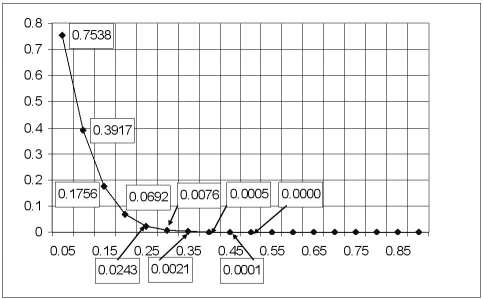
This OC curve represents a single sampling plan conducted on a lot size of 200 with a sample size of 20 and an acceptance number of 1.The y-coordinates of the first few points have been labeled; the x coordinates appear on the x-axis.If the receiving company uses rectified inspection,what is the greatest fraction defective that will enter their production process?
Correct Answer:
Verified
View Answer
Unlock this answer now
Get Access to more Verified Answers free of charge
Q1: Discuss the two incorrect conclusions that can
Q41: Why is an operating-characteristic (OC) curve useful?
Q54: Relative to an acceptance sampling plan, what
Q65: If you were interested in minimizing the
Unlock this Answer For Free Now!
View this answer and more for free by performing one of the following actions

Scan the QR code to install the App and get 2 free unlocks

Unlock quizzes for free by uploading documents