 FIGURE 8- 2
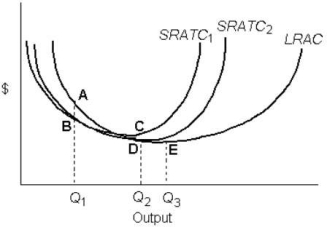
-Refer to Figure 8- 2. Increasing returns to scale occur over the output range
A) Q2 to Q3 only.
B) beyond Q3 only.
C) 0 to Q1 only.
D) Q1 to Q2 only.
E) 0 to Q3 only.
Correct Answer:
Verified
Q19: Assume a firm is using 6 units
Q20: A change in the technique for producing
Q21: Suppose that a firm is using 100
Q22: In the long run, a profit- maximizing
Q23: A short- run average total cost curve
Q25: Increasing returns to scale
A) means that output
Q26: The following table shows the marginal
Q27: A short- run average total cost curve
Q28: The creation of a new product is
Q29: Suppose that a firm is using 100
Unlock this Answer For Free Now!
View this answer and more for free by performing one of the following actions

Scan the QR code to install the App and get 2 free unlocks

Unlock quizzes for free by uploading documents