Multiple Choice
The figure below shows a family of cost curves for a firm. The subscripts 1, 2, and 3 for the SRATC curves refer to different plant sizes. 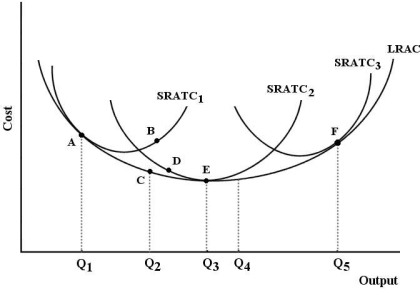 FIGURE 8- 3
-Refer to Figure 8- 3. The minimum efficient scale is achieved by this firm at output level
A) Q3.
B) Q4.
C) Q2.
D) Q1.
E) Q5.
Correct Answer:
Verified
Related Questions
Unlock this Answer For Free Now!
View this answer and more for free by performing one of the following actions

Scan the QR code to install the App and get 2 free unlocks

Unlock quizzes for free by uploading documents