The diagram below shows some short- run cost curves for a firm. 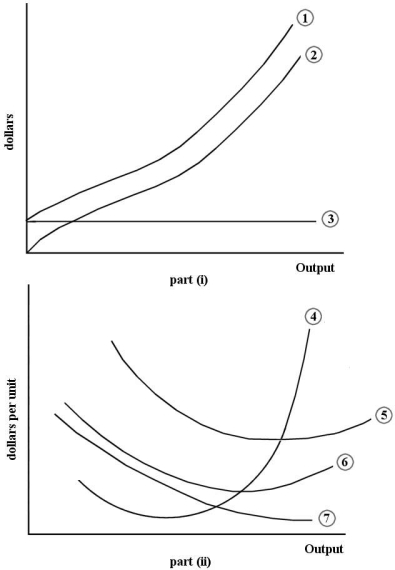 FIGURE 7- 2
-Refer to Figure 7- 2. Which of the following choices correctly identifies the cost curves in part (ii) of the figure?
A) Curve 4 is the average total cost curve. Curve 5 is the marginal cost curve. Curve 6 is the average variable cost curve. Curve 7 is the average fixed cost curve.
B) Curve 4 is the marginal cost curve. Curve 5 is the average total cost curve. Curve 6 is the average variable cost curve. Curve 7 is the average fixed cost curve.
C) Curve 4 is the marginal cost curve. Curve 5 is the average variable cost curve. Curve 6 is the average fixed cost curve.
Curve 7 is the average total cost curve.
D) Curve 4 is the marginal cost curve. Curve 5 is the average fixed cost curve. Curve 6 is the average variable cost curve. Curve 7 is the average total cost curve.
E) Curve 4 is the average fixed cost curve. Curve 5 is the average total cost curve. Curve 6 is the marginal cost curve. Curve 7 is the average variable cost curve.
Correct Answer:
Verified
Q22: Suppose a production function for a firm
Q85: An example of debt financing for any
Q87: Consider a firm in the short run.
Q88: The following data show the total
Q91: Consider a firm in the short run.
Q92: The choices listed below involve costs to
Q93: The table below provides the annual
Q94: Suppose a firm is producing 500 units
Q95: When a corporation issues a bond
A) it
Q97: The following data show the total output
Unlock this Answer For Free Now!
View this answer and more for free by performing one of the following actions

Scan the QR code to install the App and get 2 free unlocks

Unlock quizzes for free by uploading documents