 FIGURE 6- 4
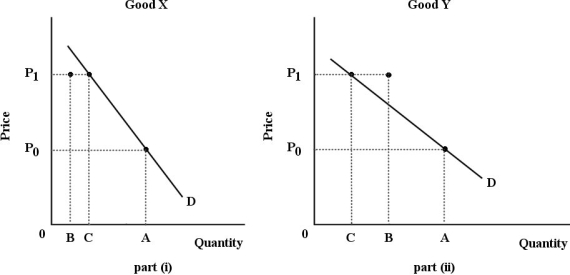
-Refer to Figure 6- 4. For both goods, the price increases from P0 to P1. The substitution effect is illustrated by the change in quantity demanded from A to B; the income effect is illustrated by the change in quantity demanded from B to C. Good X is certainly a(n) good.
A) normal
B) Giffen
C) inferior
D) luxury
E) necessity
Correct Answer:
Verified
Q4: If John consumes only two goods, A
Q6: Q7: Q8: Q10: Christine is allocating her household expenditure between Q11: The figures below show Chris's consumption of Q12: The diagram below shows a set of Unlock this Answer For Free Now! View this answer and more for free by performing one of the following actions Scan the QR code to install the App and get 2 free unlocks Unlock quizzes for free by uploading documents![]()
![]()
![]()

