 FIGURE 6- 10
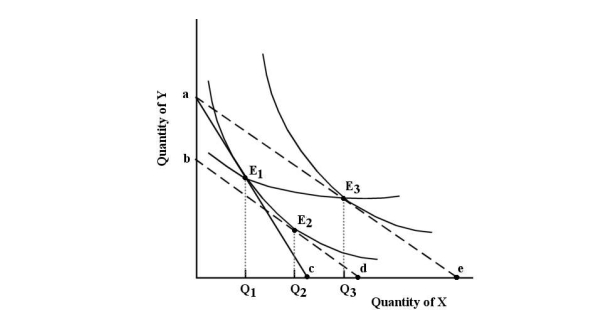
-Refer to Figure 6- 10. Suppose the consumer begins at E1. The income and substitution effects of the reduction in the price of X are represented as follows:
A) the distance Q1Q2 shows the income effect and the distance Q2Q3 shows the substitution effect.
B) the distance Q1Q2 shows the substitution effect and the distance Q2Q3 shows the income effect.
C) the distance Q1d shows the substitution effect and the distance Q2e shows the income effect.
D) the distance de shows the income effect and the distance cd shows the substitution effect.
E) the distance Q1Q3 shows the substitution effect and the distance Q2Q3 shows the income effect.
Correct Answer:
Verified
Q12: The diagram below shows a set of
Q13: Q14: Suppose a consumer can purchase only two Q15: The paradox in "the paradox of value" Q16: In indifference curve analysis, the consumer's utility- Q18: The idea that the utility a consumer Q19: The real purchasing power of an individual Q20: If total utility is decreasing as more Q22: If the price of a normal good Q39: ![]()
![]()
Unlock this Answer For Free Now!
View this answer and more for free by performing one of the following actions

Scan the QR code to install the App and get 2 free unlocks

Unlock quizzes for free by uploading documents