 FIGURE 6- 3
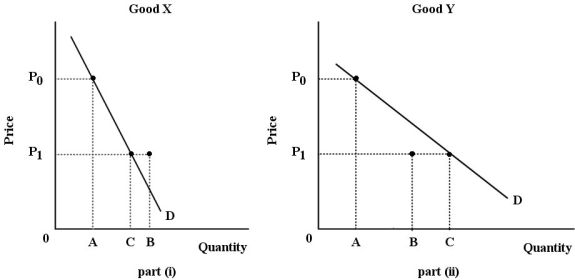
-Refer to Figure 6- 3. For both goods, the price falls from P0 to P1. The substitution effect is illustrated by the change in quantity demanded from A to B; the income effect is illustrated by the change in quantity demanded from B to C. Good X is certainly a(n) good.
A) luxury
B) normal
C) Giffen
D) inferior
E) necessity
Correct Answer:
Verified
Q4: The table below shows the quantities of
Q80: The total value that Doug places on
Q81: An equal proportional increase in money income
Q82: Consumer surplus
A) is the total value that
Q83: The diagram below shows a set of
Q84: If money income is reduced by half,
Unlock this Answer For Free Now!
View this answer and more for free by performing one of the following actions

Scan the QR code to install the App and get 2 free unlocks

Unlock quizzes for free by uploading documents