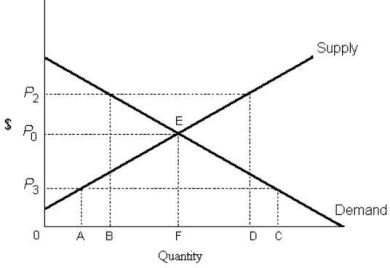
 FIGURE 5- 1
-Refer to Figure 5- 1. If the diagram applies to the market for rental housing and P3 represents the maximum rent that can be charged, then
A) units supplied will be reduced relative to the competitive equilibrium by AF rental units.
B) there will be an excess supply of rental units equal to BD.
C) there will be excess demand for rental units equal to FC.
D) there will be excess demand for rental units equal to AF.
E) windfall profits will be earned by landlords.
Correct Answer:
Verified
Q32: In practice, legislated rent controls are usually
Q33: The diagram below shows the market for
Q34: The diagram below shows the market for
Q35: Which of the following statements best differentiates
Q36: A legally imposed upper limit on a
Q38: Each point on a supply curve shows
Q39: A binding price floor is a
A) minimum
Q40: If the equilibrium price for some product
Q41: A legal price ceiling, if it is
Q42: Output quotas are commonly used in markets
Unlock this Answer For Free Now!
View this answer and more for free by performing one of the following actions

Scan the QR code to install the App and get 2 free unlocks

Unlock quizzes for free by uploading documents