The diagram below shows the market for apartments in a city. Assume that all apartments are identical. 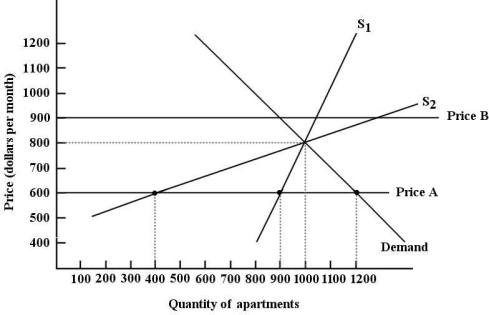 FIGURE 5- 4
-Refer to Figure 5- 4. The difference between supply curve S1 and supply curve S2 in this market for apartments is that
A) S1 is not affected by a government controlled rental price.
B) S2 is not affected by a government controlled rental price.
C) S1 is a short- run supply curve and S2 is a long- run supply curve.
D) S1 is a long- run supply curve and S2 is a short- run supply curve.
E) S1 is more elastic than S2.
Correct Answer:
Verified
Q41: A legal price ceiling, if it is
Q42: Output quotas are commonly used in markets
Q43: Government price controls are policies that attempt
Q44: If the government imposes an administered price
Q45: Consider the following demand and supply
Q47: Consider the market for any agricultural commodity
Q48: If the free- market equilibrium price for
Unlock this Answer For Free Now!
View this answer and more for free by performing one of the following actions

Scan the QR code to install the App and get 2 free unlocks

Unlock quizzes for free by uploading documents