The diagram below shows the market for apartments in a city. Assume that all apartments are identical. 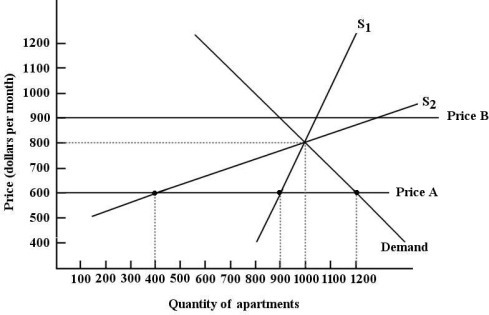 FIGURE 5- 4
-Refer to Figure 5- 4. Suppose the government sets a rent ceiling at Price B, $900. In this situation, if all apartments are rented on the black market, then the rent for an apartment is
A) any rent above $900.
B) any rent below $600.
C) $900.
D) $600.
E) the same as the free- market equilibrium rental price.
Correct Answer:
Verified
Q73: Consider Canada's east coast lobster fishery. Suppose
Q74: The short- run supply for housing is
Q75: Q76: In competitive markets, price floors and price Q77: Partial- equilibrium analysis considers Q79: In general (and in the absence of Q80: Which of the following is true of Q81: In free and competitive markets, surpluses are Q82: Consider a market that is in equilibrium Q83: If at some administered price there is![]()
A) all markets simultaneously,
Unlock this Answer For Free Now!
View this answer and more for free by performing one of the following actions

Scan the QR code to install the App and get 2 free unlocks

Unlock quizzes for free by uploading documents