 FIGURE 5- 5
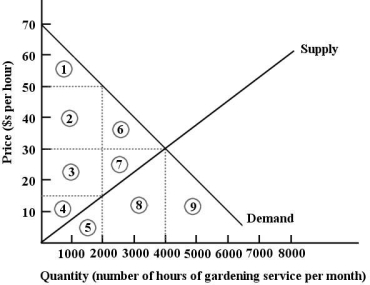
-Refer to Figure 5- 5. At the market- clearing price and quantity of $30 per hour and 4000 hours of gardening services purchased, the economic surplus is
A) the sum of the areas below the demand curve, up to 400 hours - i.e., areas 1, 2, 3, 4, 5, 6, 7, 8.
B) the sum of the areas below the demand curve - i.e., areas 1, 2, 3, 4, 5, 6, 7, 8, 9.
C) the sum of the areas below the demand curve, but above the market- clearing price of $30 - i.e., areas 1, 2, 6.
D) the sum of the areas above the supply curve, but below the market- clearing price of $30 - i.e., areas 3, 4, 7.
E) the sum of the areas above the supply curve and below the demand curve - i.e., areas 1, 2, 3, 4, 6, 7.
Correct Answer:
Verified
Q56: The long- run elasticity of supply of
Q57: Consider the following demand and supply
Q58: Q59: Consider the market for any agricultural commodity Q60: If government establishes a ceiling on the Q62: Suppose a binding output quota is imposed Q63: General- equilibrium analysis considers Q64: In free and competitive markets, shortages are Q65: Q66: Unlock this Answer For Free Now! View this answer and more for free by performing one of the following actions Scan the QR code to install the App and get 2 free unlocks Unlock quizzes for free by uploading documents![]()
A) how government planning![]()
![]()

