Multiple Choice
The diagram below shows the market for litres of milk. 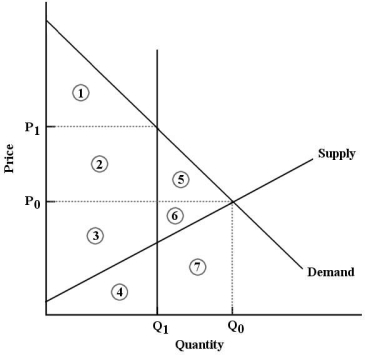 FIGURE 5- 8
-Refer to Figure 5- 8. After the imposition of a milk quota at quantity Q1, economic surplus is represented by
A) areas 3 and 4.
B) areas 1, 2 and 3.
C) areas 2, 3, 5 and 6.
D) areas 1, 2 and 5.
E) areas 1, 2, 3, 4, 5, 6 and 7.
Correct Answer:
Verified
Related Questions
Q65: Q66: Q67: Q68: In a competitive market, a legal price Q69: The diagram below shows the market for Q71: Q72: Q73: Consider Canada's east coast lobster fishery. Suppose Q74: The short- run supply for housing is Q75: Unlock this Answer For Free Now! View this answer and more for free by performing one of the following actions Scan the QR code to install the App and get 2 free unlocks Unlock quizzes for free by uploading documents![]()
![]()
![]()
![]()
![]()

