Multiple Choice
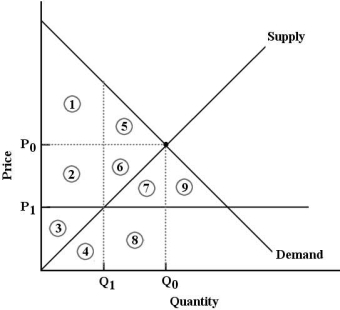 FIGURE 5- 6
-Refer to Figure 5- 6. The market for good X is in equilibrium at P0 and Q0. Economic surplus is represented by
A) areas 2, 3, 4, 6, 7, 8.
B) areas 1, 2, 3, 5, 6.
C) areas 2, 3, 4, 6, 7, 8, 9.
D) areas 1 and 5.
E) areas 1, 2, 3, 4, 5, 6, 7, 8.
Correct Answer:
Verified
Related Questions
Q90: Each point on a demand curve shows
Q91: Q92: If a binding price ceiling is in Q93: The shortage of housing that exists in Q94: If a binding price floor is in Q96: With respect to some commodity, X, if![]()
Unlock this Answer For Free Now!
View this answer and more for free by performing one of the following actions

Scan the QR code to install the App and get 2 free unlocks

Unlock quizzes for free by uploading documents