 FIGURE 4- 2
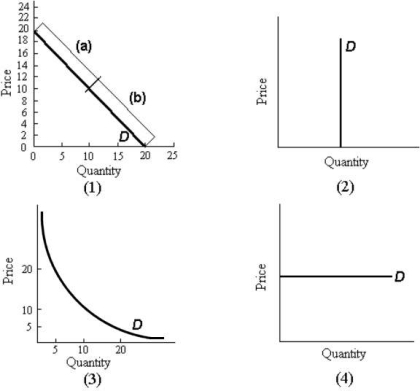
-Refer to Figure 4- 2. There is good reason to suppose that, of the four goods whose demand curves are shown in parts 1- 4 of the figure, the good that has the fewest close substitutes is shown in
A) part 1.
B) part 2.
C) part 3.
D) part 4.
E) -- there is not enough information to even make a good guess.
Correct Answer:
Verified
Q42: A vertical demand curve shows that the
Q43: If per capita income increases by 10
Q44: When the percentage change in quantity demanded
Q45: The formula for the own- price
Q46: A demand curve for which any price-
Q48: If the total expenditure on perfume increases
Q49: If Vicky's income increases by 8% and
Q50: Which of the following tends to be
Q51: Which of the following illustrates elastic demand?
A)
Q52: ![]()
Unlock this Answer For Free Now!
View this answer and more for free by performing one of the following actions

Scan the QR code to install the App and get 2 free unlocks

Unlock quizzes for free by uploading documents