Multiple Choice
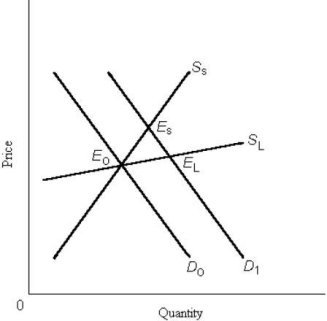 FIGURE 4- 3
-Refer to Figure 4- 3. The diagram shows a rightward shift in the demand curve for some good, and the short- run and long- run supply curves (SS and SL, respectively) . In the new short- run equilibrium after the increase in demand, producers' revenue
A) could be higher or lower than at E0, depending on the short- run elasticity of supply.
B) is unambiguously lower than at E0.
C) is unambiguously higher than at E0.
D) is unambiguously higher than at EL.
E) is unambiguously lower than in the long- run equilibrium at EL.
Correct Answer:
Verified
Related Questions
Q84: The price of apples at a local
Q85: As the price for some product decreases
Q86: When the percentage change in quantity demanded
Q87: The price elasticity of demand for a

