The diagram below shows the demand and supply curves for refrigerators in Canada. 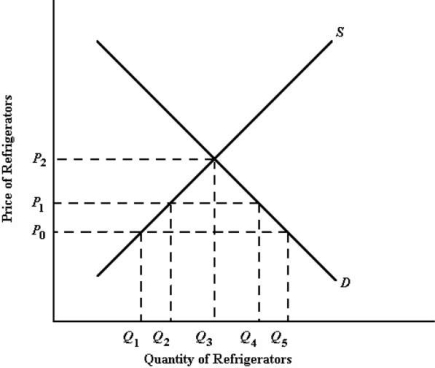 FIGURE 34- 1
-Refer to Figure 34- 1. At the price P0, the quantity of refrigerators imported into the Canadian market is
A) Q2Q5.
B) Q2Q3.
C) Q1Q5.
D) Q3Q5.
E) Q2Q4.
Correct Answer:
Verified
Q2: Continued tariff protection for industries that have
Q3: Canada and the United States have been
Q6: The diagram below shows the domestic demand
Q7: Suppose that at the current world price
Q12: Non- tariff barriers commonly used to achieve
Q13: Over the long run, protecting a domestic
Q14: The diagram below shows the domestic demand
Q15: If Canada initially has no tariffs and
Q18: In international trade, "dumping" is defined as
Q34: The diagram below shows the domestic demand
Unlock this Answer For Free Now!
View this answer and more for free by performing one of the following actions

Scan the QR code to install the App and get 2 free unlocks

Unlock quizzes for free by uploading documents