The diagram below shows the demand and supply curves for refrigerators in Canada.
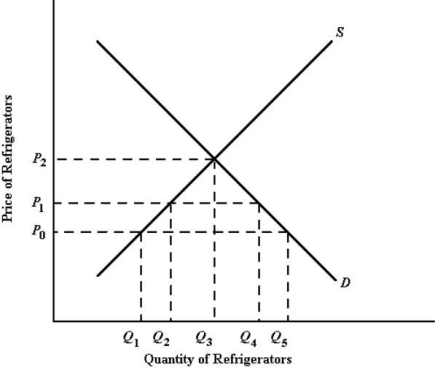 FIGURE 34- 1
-Refer to Figure 34- 1.At the price P0,the quantity of refrigerators supplied to the Canadian market by domestic Canadian producers is
A) Q1.
B) Q2.
C) Q3.
D) Q4.
E) Q5.
Correct Answer:
Verified
Q83: The diagram below shows the demand and
Q84: If Canada reduces the tariff imposed on
Q85: The diagram below shows the domestic demand
Q86: Canada is a net importer of durable
Q87: A $1 per- litre tariff on all
Q89: Suppose five countries in Central America agree
Q90: The diagram below shows the domestic demand
Q91: The concept of "trade diversion" refers to
A)trade
Q92: The diagram below shows the domestic demand
Q93: A country that implements a voluntary export
Unlock this Answer For Free Now!
View this answer and more for free by performing one of the following actions

Scan the QR code to install the App and get 2 free unlocks

Unlock quizzes for free by uploading documents