The diagram below shows supply and demand curves for bicycles in the domestic Canadian market. Assume that all bicycles are identical.
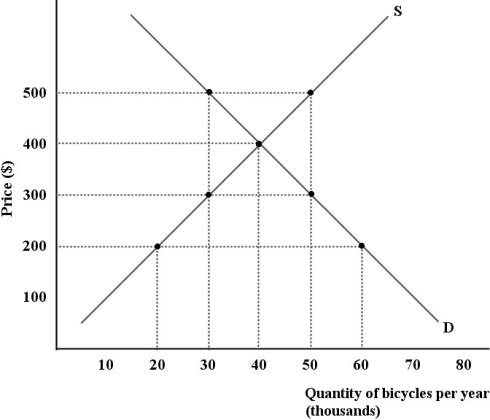 FIGURE 34- 4
-Refer to Figure 34- 4. Suppose the world price of bicycles is $200 and Canada has in place a 50- percent tariff on this good. The deadweight loss to the Canadian economy resulting from this tariff is per year.
A) $0.5 million
B) $1.5 million
C) $0
D) $2.0 million
E) $1.0 million
Correct Answer:
Verified
Q39: Any policy designed to benefit domestic industries
Q40: The table below shows the prices in
Q41: A business which contends that it needs
Q42: A tariff is
A)a tax imposed on domestically
Q43: Many people argue that the imposition of
Q45: The diagram below shows the domestic demand
Q46: Consider the following statement: "Canada is unambiguously
Q47: The diagram below shows supply and demand
Q48: If a tariff is imposed in a
Q49: A country can impose a tariff to
Unlock this Answer For Free Now!
View this answer and more for free by performing one of the following actions

Scan the QR code to install the App and get 2 free unlocks

Unlock quizzes for free by uploading documents