The diagram below shows the demand and supply curves for refrigerators in Canada. 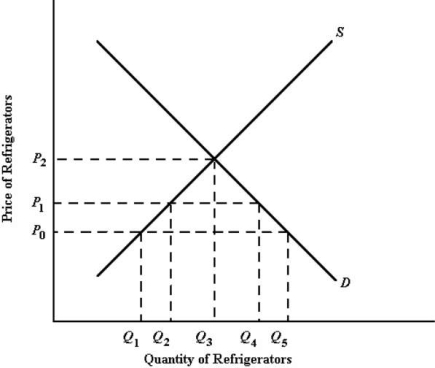 FIGURE 34- 1
-Refer to Figure 34- 1. The free- market equilibrium price of refrigerators in Canada is P0, implying that P0 is the
A) Canadian autarkic price.
B) world price.
C) tariff- protected price.
D) quota- induced price.
E) cartel- induced price.
Correct Answer:
Verified
Q59: The diagram below shows the domestic demand
Q102: The effect of a tariff on a
Q103: The diagram below shows the domestic demand
Q104: Refer to Figure 34- 1. Suppose that
Q104: Which of the following actions (all of
Q105: Suppose five countries in Central America agree
Q107: When a firm sells its product abroad
Q108: Suppose a national government chooses to impose
Q110: Suppose the Canadian government imposed more stringent
Q111: Countervailing duties are designed to offset
A)dumping.
B)a trading
Unlock this Answer For Free Now!
View this answer and more for free by performing one of the following actions

Scan the QR code to install the App and get 2 free unlocks

Unlock quizzes for free by uploading documents