The Figure Below Shows Arcticland's Annual Production Possibilities Boundary for the Production
The figure below shows Arcticland's annual production possibilities boundary for the production of fish and ice. 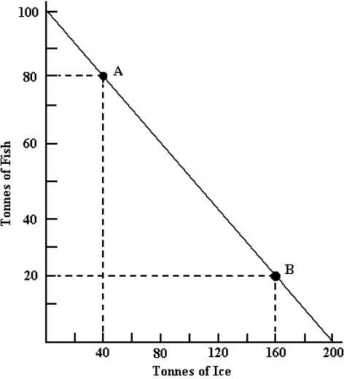 FIGURE 33- 4
-Refer to Figure 33- 4. Starting from point A and moving to point B, the opportunity cost of producing each additional tonne of ice is
A) decreasing followed by increasing.
B) decreasing.
C) increasing followed by decreasing.
D) constant.
E) increasing.
Correct Answer:
Verified
Q7: The diagram below shows the domestic demand
Q33: The diagram below shows the (hypothetical)demand and
Q35: The following production possibilities schedule shows
Q35: When two countries are specializing and trading
Q36: The diagram below shows the domestic demand
Q39: This table shows how much wine
Q40: The diagram below shows the domestic demand
Q41: When opportunity costs are identical between two
Q43: The following production possibilities schedule shows
Q44: The figure below shows Arcticland's annual production
Unlock this Answer For Free Now!
View this answer and more for free by performing one of the following actions

Scan the QR code to install the App and get 2 free unlocks

Unlock quizzes for free by uploading documents