The diagram below shows the domestic demand and supply curves in the market for newsprint in Paperland.
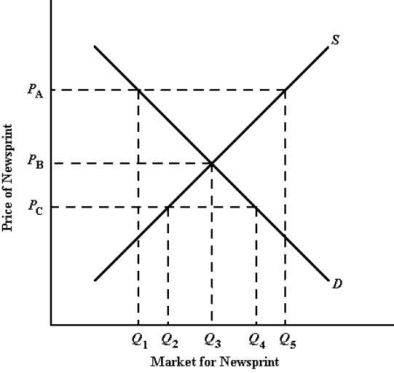 FIGURE 33- 5
-Refer to Figure 33- 5.If Paperland engages in trade and the world price is PA,the residents of Paperland will consume units of newsprint.
A) Q1
B) Q2
C) Q3
D) Q4
E) Q5
Correct Answer:
Verified
Q22: The diagram below shows the domestic demand
Q23: The diagram below shows the (hypothetical)demand and
Q24: Since joining NAFTA in the early 1990s,Canada
Q25: The hypothesis that the price of some
Q26: The diagram below shows the domestic demand
Q28: The figure below shows Arcticland's annual production
Q29: If the index of export prices increases
Q30: The diagram below shows the domestic demand
Q31: When opportunity costs differ between countries,
A)only the
Q32: When opportunity costs are identical between two
Unlock this Answer For Free Now!
View this answer and more for free by performing one of the following actions

Scan the QR code to install the App and get 2 free unlocks

Unlock quizzes for free by uploading documents