 FIGURE 33- 2
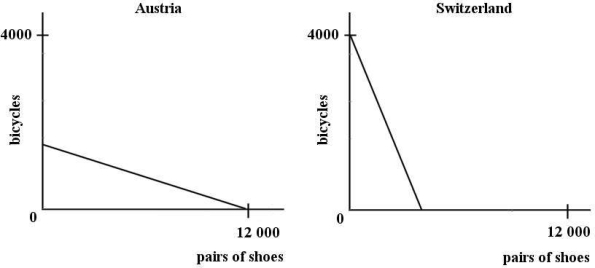
-Refer to Figure 33- 2. The diagrams illustrate that the is lower in Austria than in Switzerland.
A) opportunity cost of producing shoes
B) opportunity cost of producing bicycles
C) comparative advantage in producing bicycles
D) average cost of producing bicycles
E) total cost of producing shoes
Correct Answer:
Verified
Q22: The diagram below shows the domestic demand
Q28: Canadians consume millions of cups of Tim
Q30: The division of the gains of trade
Q47: Economies of scale and product differentiation can
Q50: If the index of export prices increases
Q52: The diagram below shows the (hypothetical)demand and
Q53: If a product is very inexpensive to
Q58: This table shows how much wine
Q59: The "law of one price" states that
Q61: The diagram below shows the domestic demand
Unlock this Answer For Free Now!
View this answer and more for free by performing one of the following actions

Scan the QR code to install the App and get 2 free unlocks

Unlock quizzes for free by uploading documents