The Figure Below Shows Arcticland's Annual Production Possibilities Boundary for the Production
The figure below shows Arcticland's annual production possibilities boundary for the production of fish and ice. 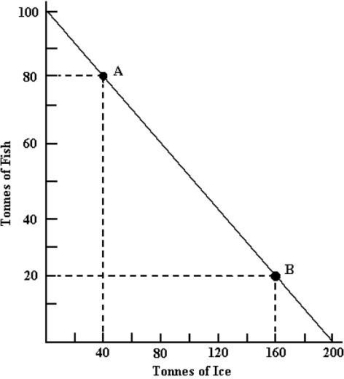 FIGURE 33- 4
-Refer to Figure 33- 4. Suppose that a trading partner offers to give Arcticland some fish in exchange for its ice. If Arcticland is to improve its consumption possibilities, the terms of trade must be 1 tonne of fish for
A) 5 tonnes of ice.
B) 4 tonnes of ice.
C) 3 tonnes of ice.
D) 2 tonne of ice.
E) 1 tonne of ice.
Correct Answer:
Verified
Q24: If Country A has a comparative advantage
Q33: The diagram below shows the (hypothetical)demand and
Q34: The diagram below shows the domestic demand
Q35: When two countries are specializing and trading
Q39: This table shows how much wine
Q39: Consider two countries that can produce rice
Q40: The figure below shows Arcticland's annual production
Q41: When opportunity costs are identical between two
Q43: The following production possibilities schedule shows
Q47: ![]()
Unlock this Answer For Free Now!
View this answer and more for free by performing one of the following actions

Scan the QR code to install the App and get 2 free unlocks

Unlock quizzes for free by uploading documents